Query Explorer
Syntra Query Explorer is a built-in SQL client that ships with every Syntra ODBC install. Use it to verify your connection, browse the QuickBooks schema, run ad-hoc SQL, and test native QuickBooks reports without installing a separate database client.
Launch
Section titled “Launch”Open the Start Menu and select Syntra Query Explorer, or run syntra-query-explorer.exe from the installation directory. On first launch it reads the defaults from config.toml and pre-fills the connection panel.
Connection panel
Section titled “Connection panel”The connection panel at the top of the window has four fields:
| Field | Default | Source |
|---|---|---|
| Host | 127.0.0.1 | config.toml [server].host |
| Port | 5433 | config.toml [server].port |
| Username | qbconnect | config.toml [auth].username |
| Password | from config | config.toml [auth].password |
Click Connect to open the session. The status bar at the bottom shows the connection state.
SQL editor
Section titled “SQL editor”The center pane is a SQL editor. Type or paste any query Syntra supports:
SELECT,JOIN,WHERE,GROUP BY, aggregates, CTEs, subqueries, and window functions- write operations such as
INSERT,UPDATE, andDELETEwhen your plan supports writes - special
CALLprocedures such asqb_void,qb_sync_table, and native report procedures likeqb_inventory_valuation_summaryorqb_report
Press Execute (or the keyboard shortcut shown on the button) to run the statement. Results appear in the table panel below.
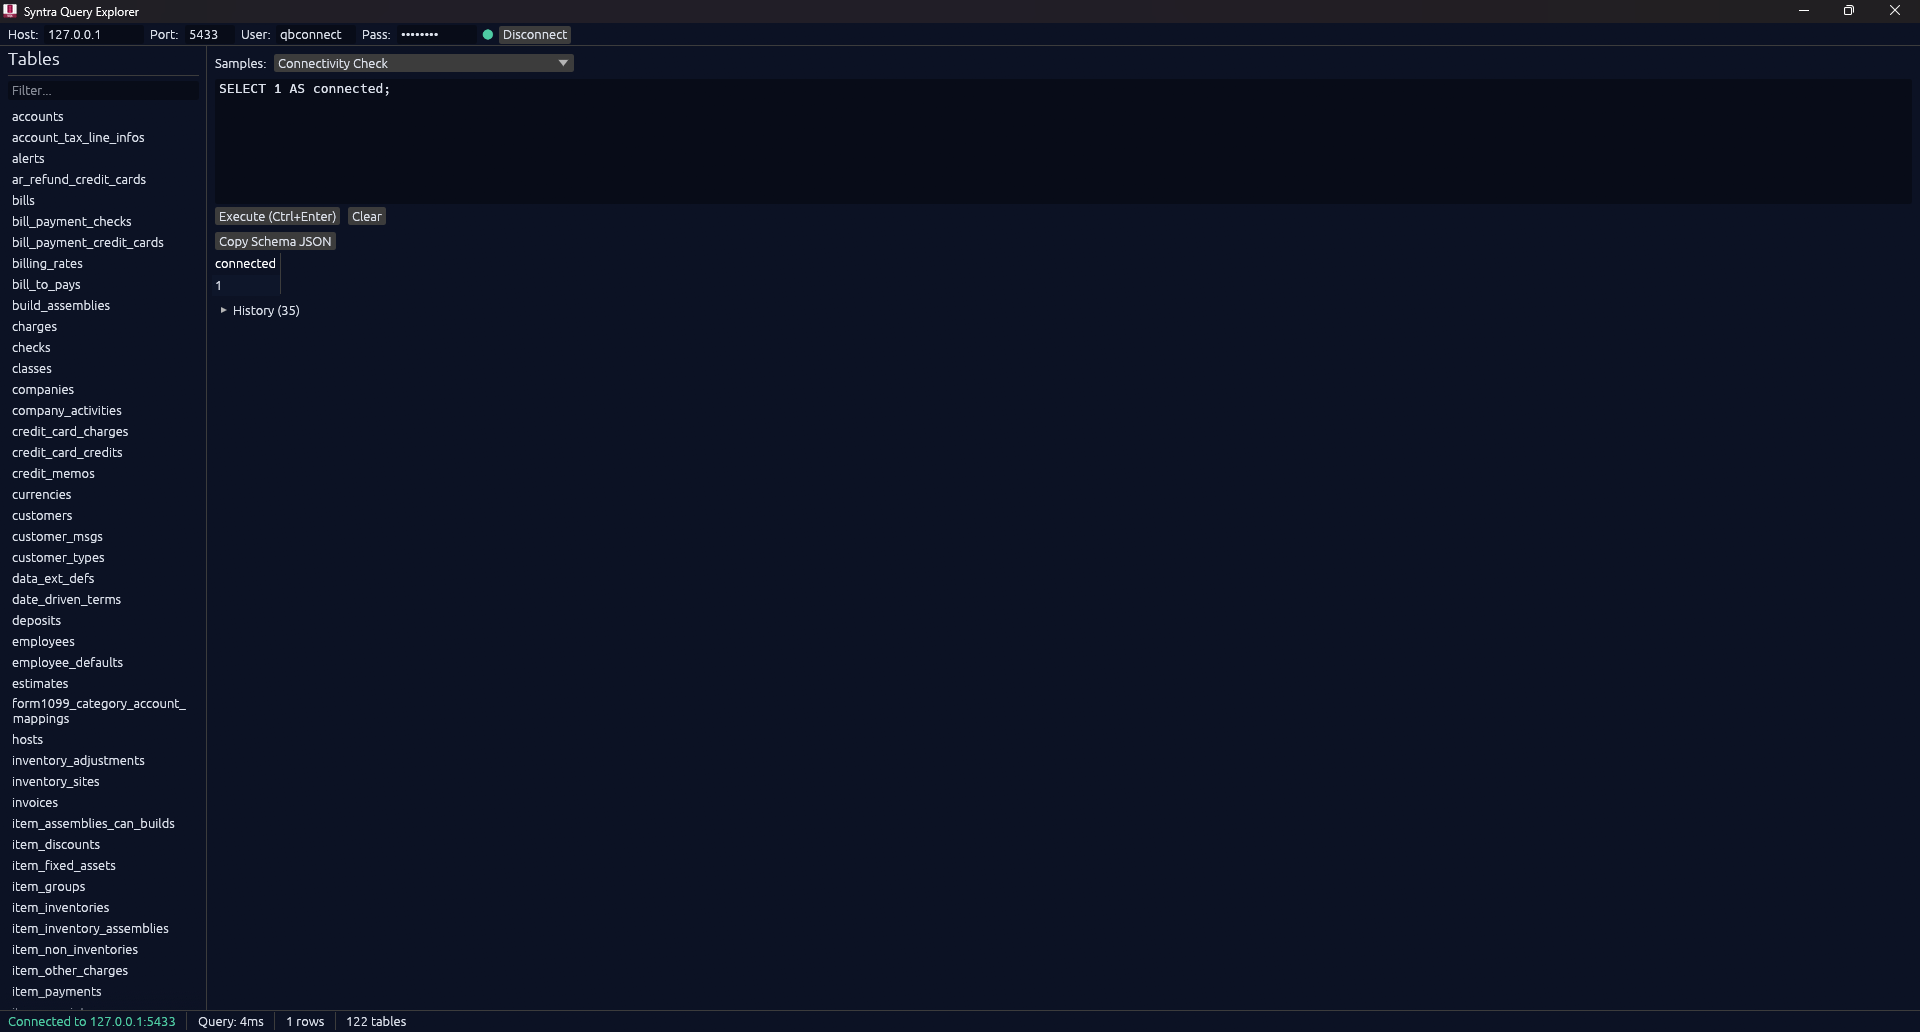
Sample queries
Section titled “Sample queries”A Sample Queries dropdown sits above the editor. It loads common starter queries so you can verify connectivity and explore the schema without typing.
Included samples cover:
- connectivity checks
- customer and invoice listing
- joins and aggregate queries
- inventory browsing
- native report examples such as Inventory Valuation Summary
Selecting a sample drops the SQL into the editor. Edit or run it as-is.
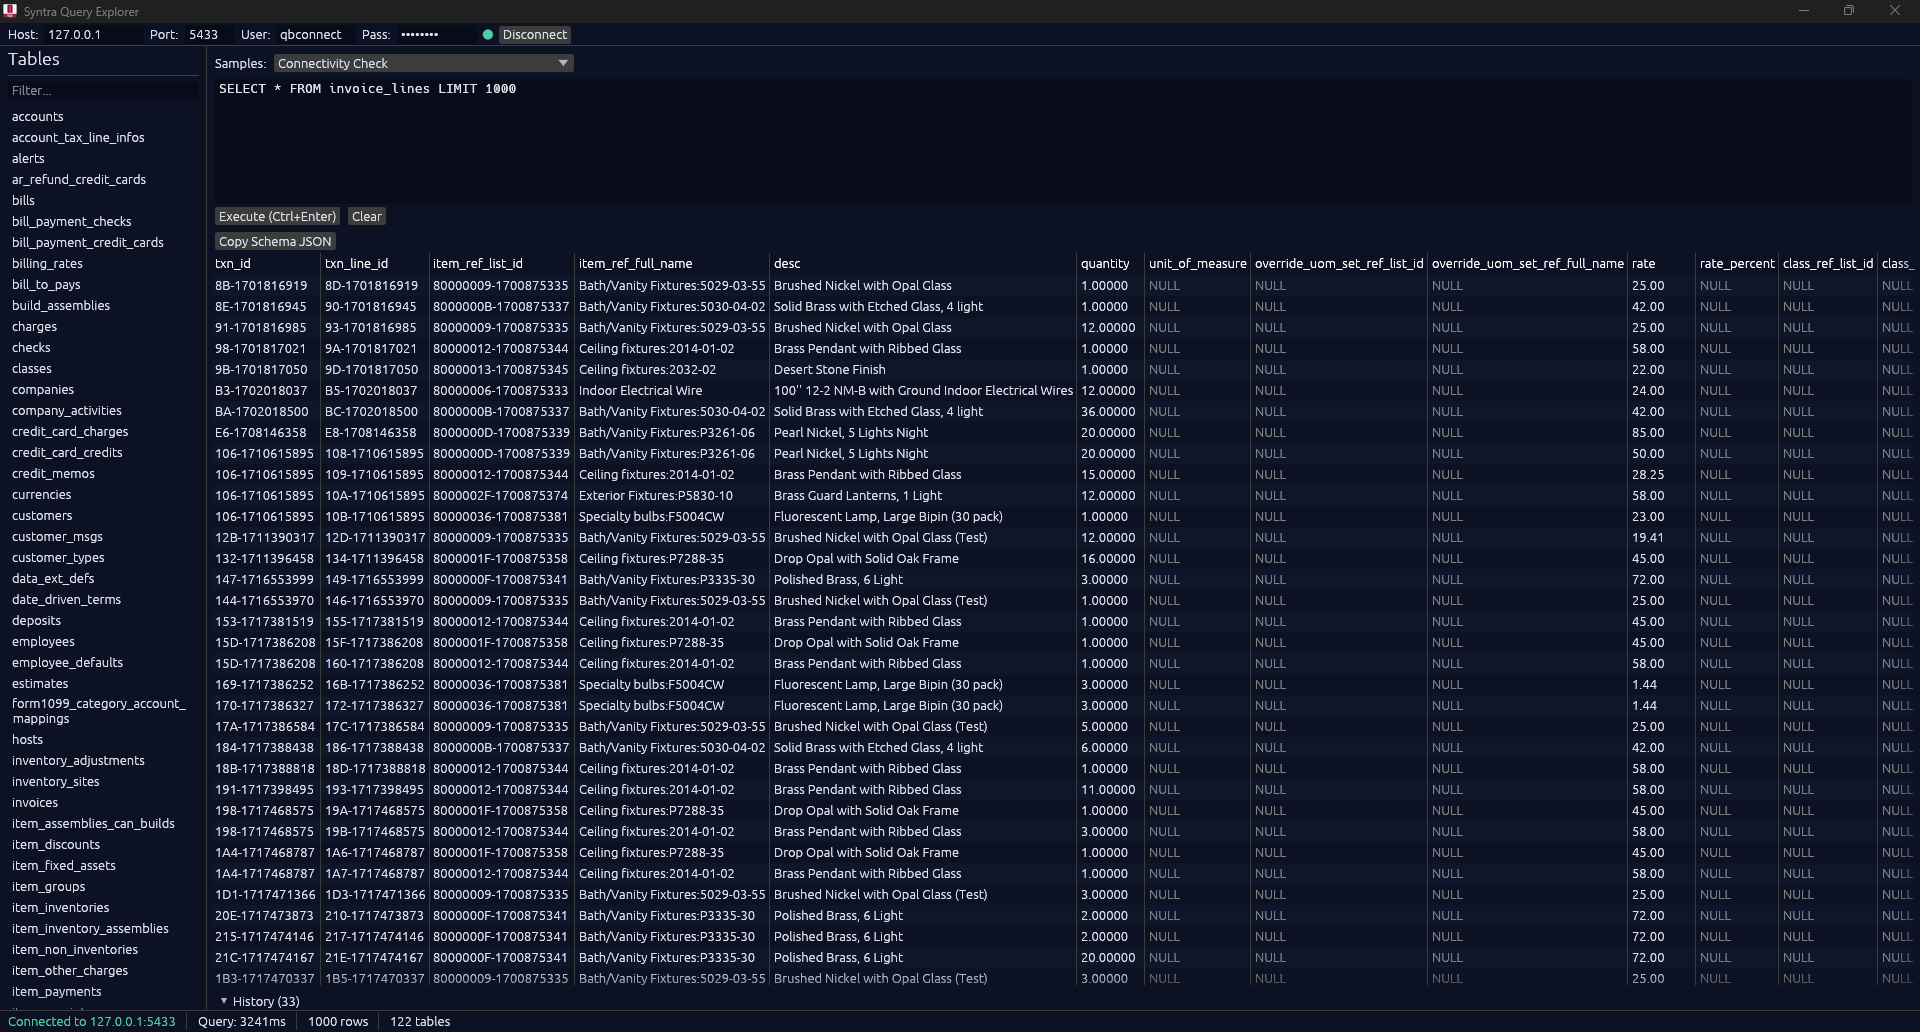
Results table
Section titled “Results table”After a query runs, the bottom pane shows the result set as a scrollable table:
- Column headers are clickable and show the column’s name, SQL type, and type code
- NULL values are rendered in a muted color so they are distinguishable from empty strings
- Row count is capped at 10,000 displayed rows; if the underlying query returns more, the Explorer shows a warning with the total
- Resizable columns let you adjust widths within the current session
- Striped rows improve readability on wide result sets
Report results
Section titled “Report results”Native QuickBooks reports now return a human-readable rowset by default. In practice that means:
- report rows include metadata such as
report_name,report_title,row_kind,row_label, andsection_path - the report’s own value columns appear after the base metadata fields
- the exact value columns vary by report and by report layout
Examples:
- Inventory Valuation Summary commonly returns
on_hand,avg_cost, andasset_value - Profit & Loss summarized by month can return
jan_26,feb_26,mar_26, and similar columns
If you need the low-level cell-by-cell layout instead, run one of the raw procedures such as CALL qb_report_raw(...).
Copy Schema JSON
Section titled “Copy Schema JSON”When a result set is displayed, a Copy Schema JSON button appears above the table. Click it to copy a JSON array of { name, type, oid } objects, one per column, to the clipboard.
Example output for SELECT list_id, time_created, is_active, sublevel, balance, account_number FROM accounts:
[ { "name": "list_id", "type": "varchar", "oid": 1043 }, { "name": "time_created", "type": "timestamp", "oid": 1114 }, { "name": "is_active", "type": "bool", "oid": 16 }, { "name": "sublevel", "type": "int4", "oid": 23 }, { "name": "balance", "type": "numeric", "oid": 1700 }, { "name": "account_number", "type": "varchar", "oid": 1043 }]This is useful for ORMs, BI tooling, code generation, and checking the exact columns produced by a report query.
Browser panel
Section titled “Browser panel”A dedicated Report Builder panel appears on the right side of the window when you select a native report. It shows the report family, date mode, required filters, common options, validation messages, generated options_json, and the final CALL qb_report(…) statement before you load it into the editor.
The left panel includes two catalogs:
- Tables: every Syntra SQL table
- Reports: every native QuickBooks report currently exposed by Syntra
Table browsing
Section titled “Table browsing”Click a table to inspect its column list. Use this to discover entity and column names without leaving the Explorer.
Report browsing
Section titled “Report browsing”Click a report name to open it in the Report Builder and generate a starter CALL qb_report(...) statement for the SQL editor.
The Explorer chooses the template based on the report’s date mode:
- range reports get
start_dateandend_date - as-of reports get
as_of_date - no-date reports get
NULLdates
Special cases also get safer defaults. For example, MissingChecks pre-fills an account filter because QuickBooks requires that report to target a real account.
Query history
Section titled “Query history”Recently executed queries are listed in the history panel. Click any entry to reload it into the editor. History persists for the current session.
- Start with the Connectivity Check sample if you are not sure the Syntra service is up
- Use the Reports list on the left to explore native QuickBooks reports without memorizing report names
- Use Copy Schema JSON after running a report to capture the exact columns your BI tool or code should expect
- If a report fails, check whether it is an as-of report, a range report, or a no-date report before changing the SQL
- If the Connect button fails, confirm
syntra-odbc.exeis running and QuickBooks Desktop is open with a company file
See also
Section titled “See also”- Native Reports for the full report procedure reference, filters, and customization options
- First Connection for the end-to-end setup walkthrough
- SELECT Queries for the general SQL surface
- Type Reference for Syntra’s SQL type mappings
- Connection Strings for connecting from your own applications